Personal Project - Coronavirus Disease (COVID-19)
This analysis was performed using John Hopkins data for the 2019 Novel Coronavirus COVID-19 (https://github.com/CSSEGISandData/COVID-19). Data cleanup was performed using pandas. Additional data visualizations are availabe on my Tableau page.

Click Here to View Code for Above Project on GitHub
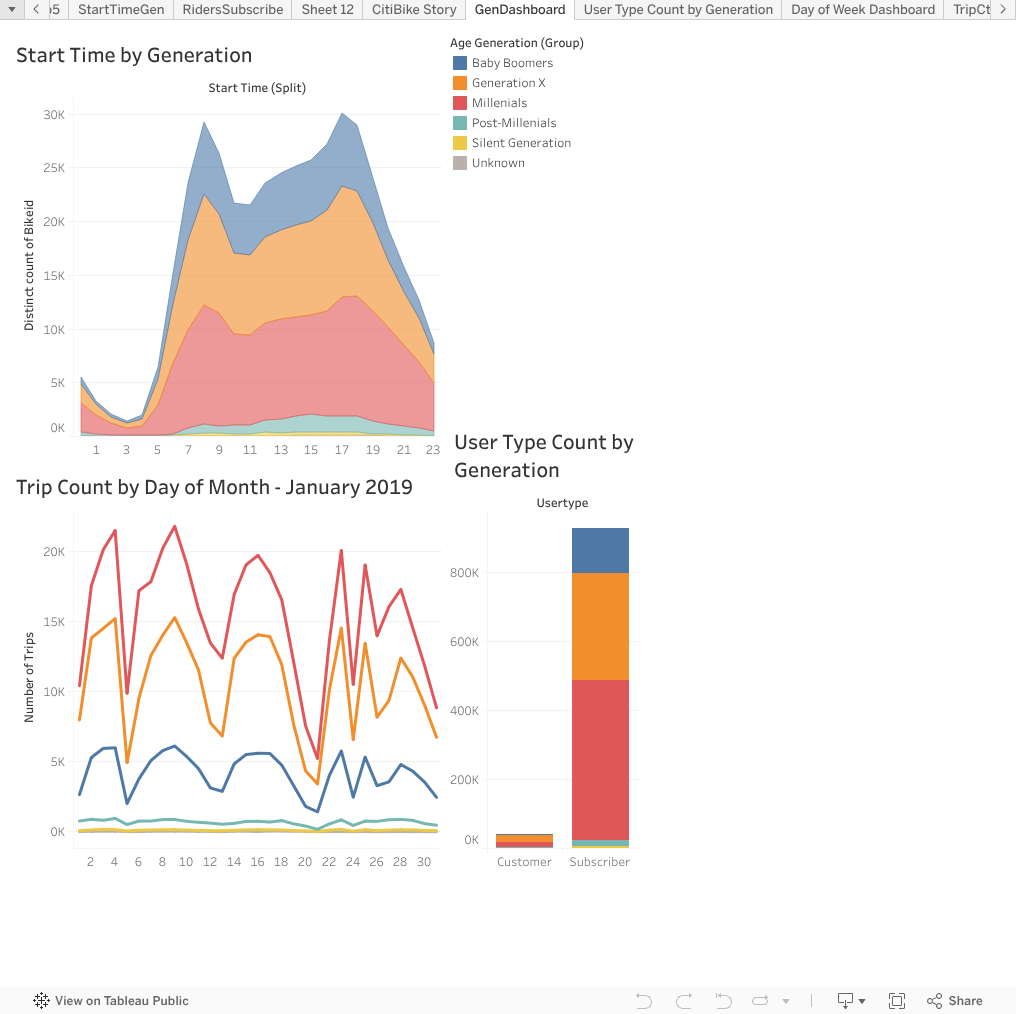
Analyzing Citibike Data Using Tableau
The goal of this project was to analyze Citibike data for trends using Tableau, which I found to be the most user friendly of all the data visualation technologies we learned at Georgia Tech. The below graphs are embedded from my Tableau Public page. Not only is Tableau ideal for the data analyst, I've found it to be most beneficial for the end user since you are able to hover over the lines of the graph to get exact counts for each variable at any point in the graph.
Click Here to View Above Project on Tableau Public
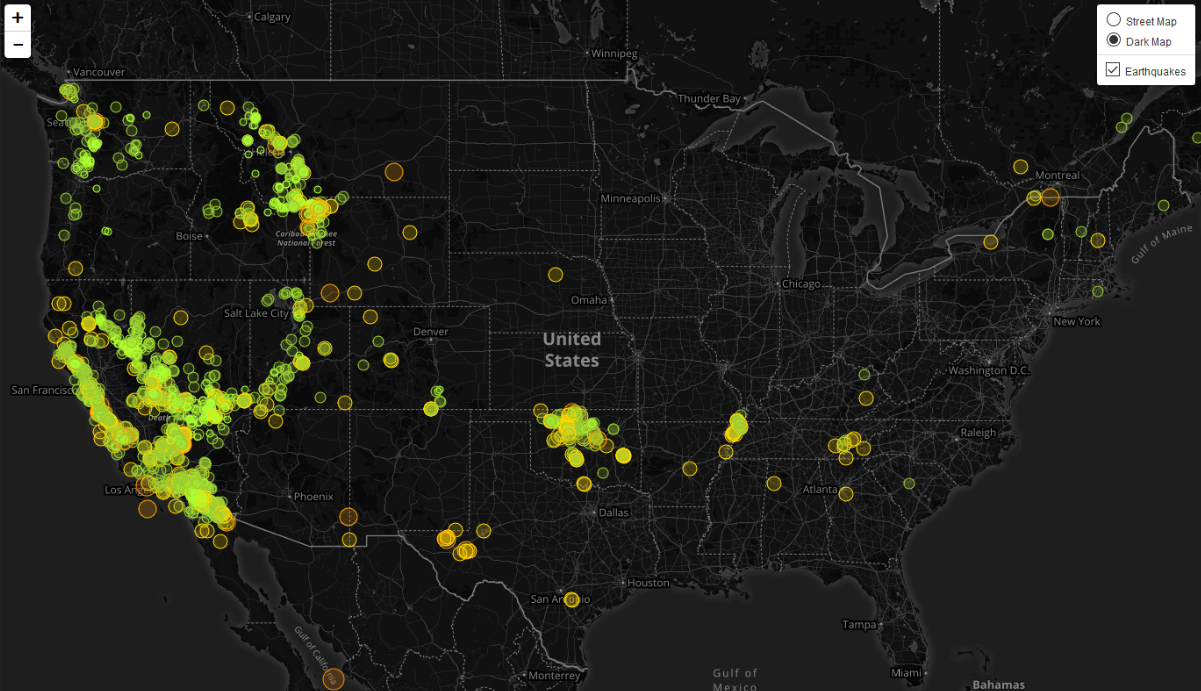
Mapping GeoJSON Data with Leaflet
Below is a map created using Leaflet from data in GeoJSON format. The USGS provides earthquake data updated every 5 minutes. The data markers reflect the magnitude of the earthquake in their size and color. Earthquakes with higher magnitudes appear larger and darker in color.
Click Here to View Code for Above Project on GitHub
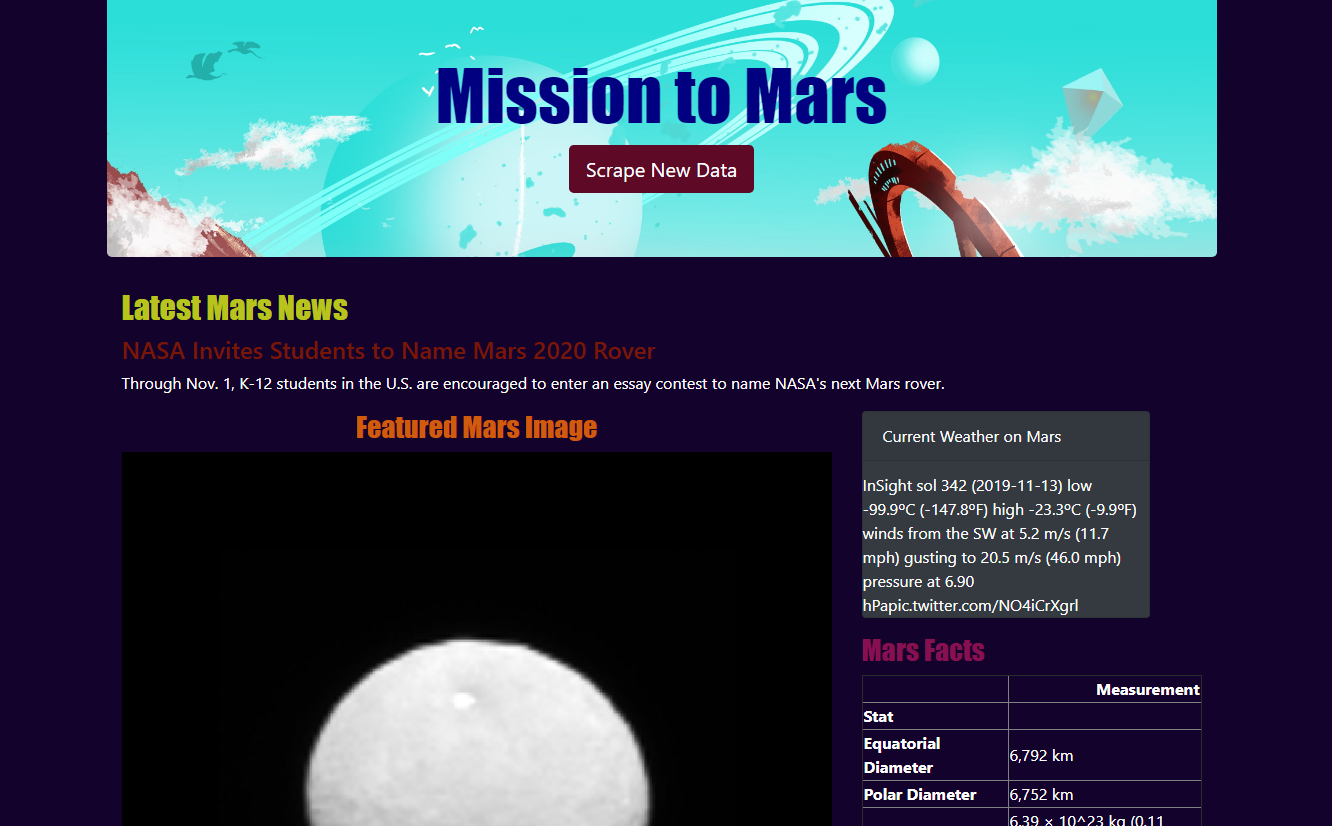
Web Scraping
Mission to Mars is a website that pulls information and images from space-facts.com, nasa.gov, and Twitter to display real time data using Flask, a micro web framework.
 Click Here to View Code for Above Project on GitHub
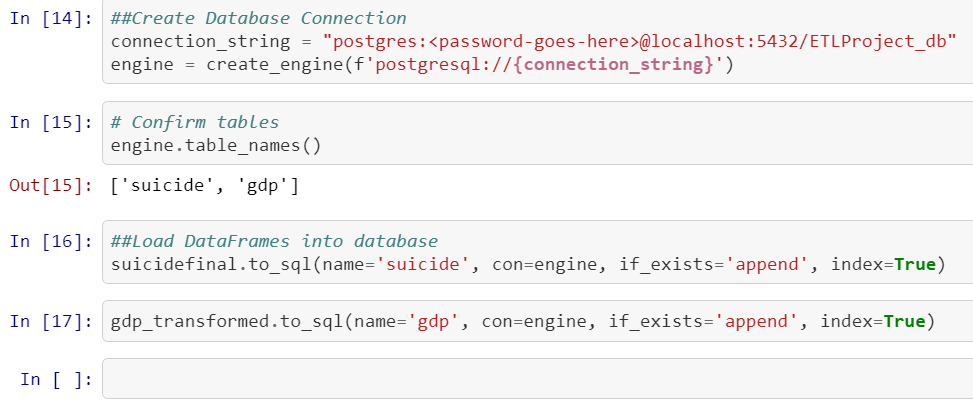
ETL Project
The goal of this project was to find two data sets and perform ETL on the data. I extracted data from two different cvs files, used pandas to clean the data, and then SQLAlchemy to upload to Postgres, a relational database management system. Below is a screenshot of some of my code from Jupyter Notebook and my full write up can be found in the above link.
Click Here to View Code for Above Project on GitHub
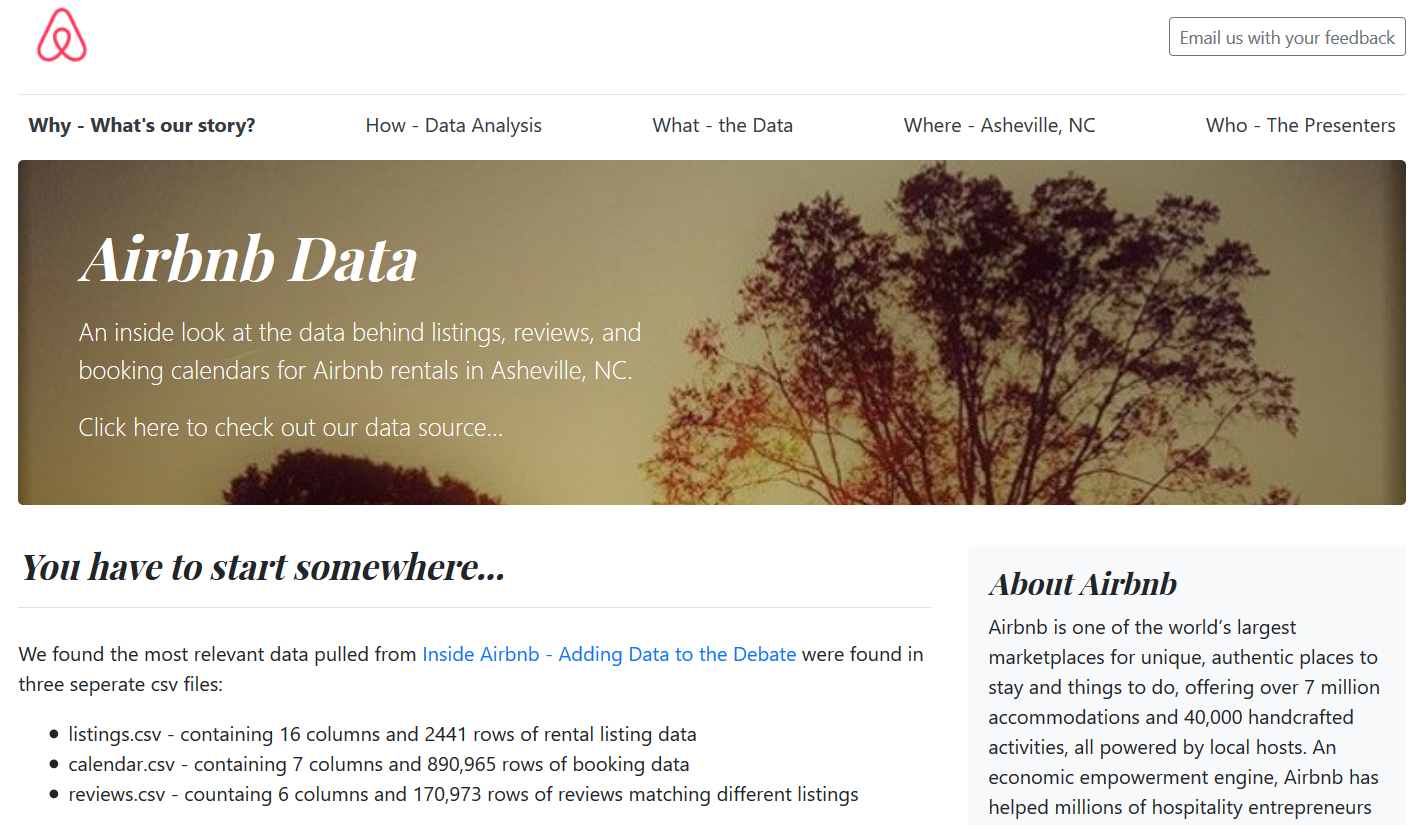
Website Project for Machine Learning with Airbnb Data
Below is a screenshot of a website I built as a final project for the Georgia Tech Data Science and Analytics bootcamp. My contribution to this group project was building the website using Bootstrap and performing machine learning analysis on the data using sklearn's model, fit, predict methods. Our goal was to analyze Airbnb data using machine learning and sentiment analysis to then build a site which showcased a step by step guide to some of our challenges with that particular data set in order to assist future students since that data source is commonly used in data competitions and student projects.
Click Here to View Code for Above Project on GitHub